Surprising fact: retail buyers often pay 5–15% more than the market reference when they take home coins or bars. That gap can change how quickly you reach break-even and how much your holdings are worth when you sell.
This short guide will define the core question in plain terms: what the market reference is versus what you actually pay for delivered bullion, and why that gap matters when you want to make informed decisions. We focus on the U.S. market and common products used by investors.
Expect a practical, step-by-step look at the two-price reality: a wholesale benchmark and a retail total that adds dealer costs, fabrication, and fees. We’ll explain what a premium means at a high level and why it can spike when demand rises or inventory drops. Examples include American Silver Eagles, rounds, and bars to show how different items carry different added costs.
Key Takeaways
- The market reference is not the final amount you pay; retail adds extra costs.
- Understanding added costs helps investors compare offers and estimate resale value.
- Premiums can rise quickly with demand or low stock.
- Coins, rounds, and bars often carry different added costs even at the same reference.
- Real examples and common retail fees make it easier to judge offers.
Why the silver spot price changes all day and what it really represents
Think of the spot number as a snapshot of the market at a single second. It shows the current reference for immediate settlement in the metals market. Traders use it for same-day trades, but it is not a guaranteed retail offer.
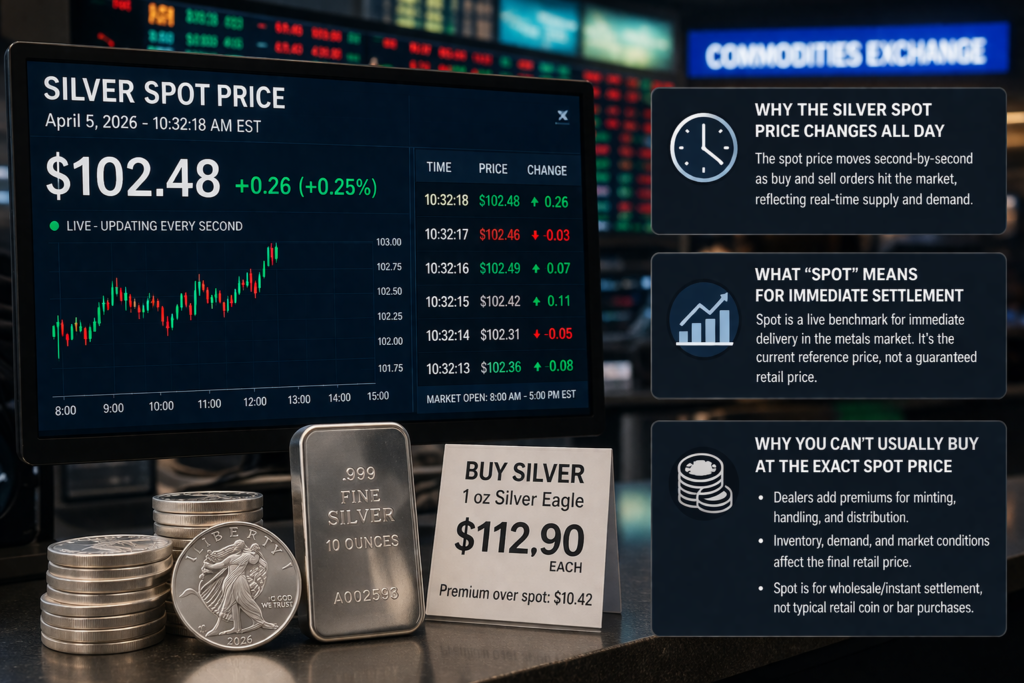
What “spot” means for immediate settlement
The spot price is a live benchmark. It updates during open hours as buy and sell orders hit exchanges. That constant flow makes small changes add up over time.
Why you can’t usually buy a coin or bar at the exact spot price
Finished products include minting, shipping, and dealer operating costs. Dealers add a markup to cover those costs and risk. When you sell back, buyback quotes are often below the reference — part of a bid-ask spread you must overcome.
“Spot is a raw benchmark; a coin or bar is a finished product with real-world costs.”
- The live ticker may shift while you shop.
- Dealers adjust listings to reflect market changes and demand.
How spot price silver is set in global trading markets
The live benchmark emerges from constant trading across venues, not from a single source. Market participants in different regions send orders that match and update the public reference in real time.
COMEX futures and near‑round‑the‑clock discovery
COMEX drives much of the day-to-day movement. Electronic futures trade nearly 23 hours a day and most contracts represent 5,000 troy ounces, which shows how institutional flows differ from retail buying.
The LBMA daily auction as a commercial anchor
The London auction run by IBA sets a noon benchmark that dealers use for big trades. That single reference helps settle large contracts and guides wholesale pricing for bullion houses.
Follow‑the‑sun trading across regions
Exchanges in Asia, Europe, and North America hand liquidity to one another, so the reference can shift at odd hours for U.S. buyers. Watching gold and the broader precious metals market gives context to these moves and their impact on local prices.
Next: even though the benchmark is global, the markup you see at retail often depends on local supply and product type.
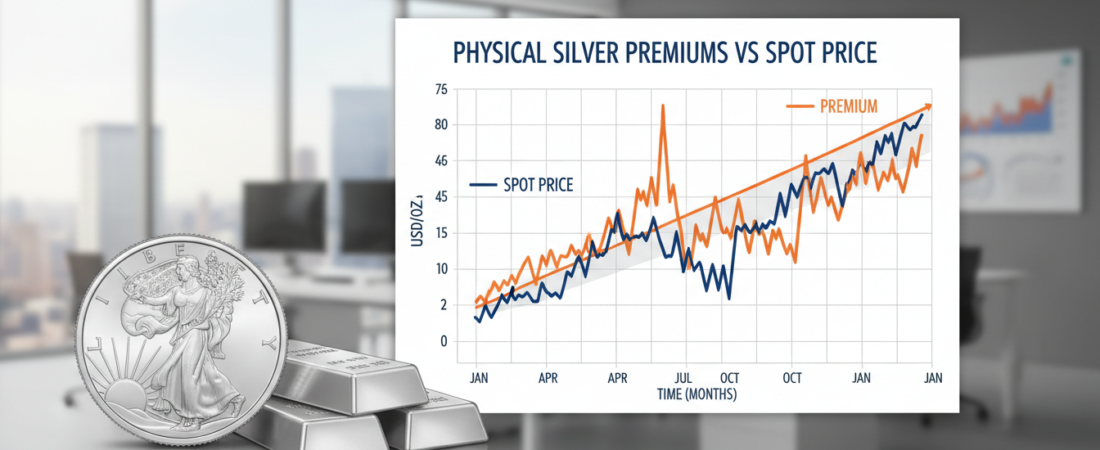
Physical silver premiums vs spot price explained: the real costs behind the markup
What looks like a single markup is actually several distinct charges passed along the chain. Buyers see one number at checkout, but that total hides many layers of cost.

Our #1 Company Recommendation for Bullion!
Dealer, product, and fabrication layers
Dealer fees cover overhead, storage, and profit. They vary by firm and order size.
Product premiums reflect format and brand — coins often cost more per ounce than bars.
Fabrication is minting quality, packaging, and QC steps that add tangible cost.
Market pressure and demand spikes
When demand outstrips supply, a market premium appears. It can jump fast even if the benchmark is calm.
“Market spikes act like a pressure valve; inventory shortages translate into higher retail asks.”
Supply chain: mine to buyer
High-level flow: mining → refining → blanks → minting → wholesaler → dealers → shipping/insurance. Each stage adds time and cost.
| Cost Layer | Typical Driver | Impact on 1 oz Coin | Notes |
|---|---|---|---|
| Fabrication | Mint steps, QC | Higher per-ounce | Coins need more handling than bars |
| Dealer | Overhead & margin | Variable by seller | Smaller orders raise per-unit cost |
| Market | Supply shortages | Can spike quickly | Seen during high-demand periods |
- The same product can carry different totals at different dealers.
- Tight supply and mint backlogs push wholesale costs up, then retail follows.
Next: product type is a major factor in what you’ll actually pay for a given ounce.
How premiums differ by product type: coins, rounds, and bars
What you hold — coin, round, or bar — can swing the per-ounce cost even when the market is steady. Choose format with your goal in mind: easiest resale, lowest cost per ounce, or collectible value.
Government coins and why American Silver Eagles often carry higher premiums
Government-minted coins usually command higher retail marks. Recognizability, legal tender status, and steady demand keep their per-ounce additions elevated.
American Silver Eagles are the prime example. Buyers pay more because dealers know they sell quickly and broadly.
Generic rounds as a middle-ground option for investors
Generic 1 oz rounds sit between coins and bars on cost. They trade easily like a coin, but fabrication is simpler, so the per-ounce add-on is lower.
For investors who want easy-to-trade single-ounce units without the highest markup, rounds are a practical choice.
Our #1 Company Recommendation for Bullion!
Bars and why larger sizes can reduce per-ounce cost
Bars, especially 100 oz or larger, typically lower the per-ounce add-on. Fewer units, simpler minting, and reduced handling all cut costs.
If your goal is maximum ounces per dollar, larger bars usually offer the best value.
| Format | Typical Per‑Ounce Add‑On | Liquidity | Best Use |
|---|---|---|---|
| Government coin (e.g., American Silver Eagle) | Highest | Very high | Easy resale, collectors |
| Generic 1 oz round | Moderate | High | Balanced cost and tradeability |
| Large bars (10–100 oz+) | Lowest | Moderate | Max ounces per dollar, storage |
Buyer tip: match the product to your objective — choose coins for resale simplicity, rounds for flexibility, and bars for lowest cost per ounce. Remember that within each category, marks can swing with short-term supply and demand.
What drives premium swings in the precious metals market
Availability at the dealer and mint level drives the clearest and quickest changes in what buyers pay. Short supply for a popular coin or bar can push retail marks higher even when the market is steady.
Supply shocks, mint backlogs, and tight inventory
Shortages are the biggest catalyst. When mints fall behind or wholesalers run low, dealers must compete for stock. That raises delivered costs for buyers.
Backlogs ripple through wholesale channels and show up as wider asks on high-demand government issues.
Industrial demand and competing uses
Demand from solar, EV, and electronics sectors eats into refined material available for investors.
This steady industrial pull can keep overall supply tight and support higher prices for metal products over time.
Volatility, dealer risk, and widening spreads
When market swings get sharp, dealers widen spreads to manage exposure. That means higher transaction costs for retail customers during volatile periods.
Seasonality and buying patterns
Q4 often shows stronger retail demand around holidays and year-end planning. Summer months can bring more competitive offers as activity slows.
“Compare total delivered cost, not just the advertised add-on — swings are normal in precious metals.”
Reality check: swings happen regularly. If deficits persist into 2025, both market levels and retail marks can stay elevated longer than many expect.
What 2026 market conditions mean for spot prices and premium ranges
The silver market in 2026 is operating under completely different conditions than 2025—and that has a direct impact on premiums.
As of early 2026, silver has surged past the $100 per ounce level, breaking a major psychological barrier and entering a new pricing regime . This is not a typical bull market—it’s being driven by a combination of supply deficits, industrial demand (AI, solar, defense), and global monetary shifts.
That matters because premiums are no longer just about fabrication costs—they now reflect tight physical supply, dealer inventory risk, and surging investor demand.
Instead of the old $29–$36 range from 2025, investors today should benchmark premiums against $90–$110+ spot levels, depending on daily volatility.
Typical 2026 retail ranges (updated quick reference)
With silver now trading in triple digits, premiums have compressed slightly in percentage terms—but remain elevated in absolute dollars due to ongoing supply stress.
- American Silver Eagles (1 oz coins): roughly $12–$20 over spot
- Generic 1 oz rounds: about $5–$9 over spot
- 100 oz bars: around $3–$5 per ounce over spot
- 90% silver coinage: typically 8–20% over melt value (depending on availability and bag size)
Context that matters in 2026
The premium environment today is being shaped by structural forces—not short-term hype:
- Supply constraints remain severe: Around 75% of silver production is a byproduct of other mining, limiting how fast supply can respond to higher prices
- Global output remains tight: Prior global mine supply hovered around ~800M oz annually, with limited ability to expand quickly
- Industrial demand is exploding: AI infrastructure, solar energy, and defense applications are consuming more silver than ever
- Inventories are shrinking: London and New York vaults have seen multi-decade drawdowns due to physical demand
- Investment demand is accelerating: Retail and institutional buyers are both competing for the same physical supply
2026 premium benchmark table
| Item | Typical 2026 Range | When “elevated” |
|---|---|---|
| ASEs (1 oz) | $12–$20 over spot | Above $20 = tight retail supply |
| Generic rounds (1 oz) | $5–$9 over spot | > $10 = supply stress |
| 100 oz bars | $3–$5/oz over spot | > $5.50 = wholesale strain |
| 90% coinage | 8–20% over melt | > 20% = strong retail demand |
How to interpret premiums in this market
A key shift in 2026:
High premiums don’t necessarily mean “overpriced” anymore—they often signal real scarcity.
- In 2025, high premiums were often temporary spikes
- In 2026, elevated premiums are increasingly structural and persistent
- The market is transitioning from a paper-driven pricing model to a physical availability model
In other words:
👉 If spot is $100 and you’re paying $115–$120 for a recognizable coin, that may still be a fair deal in this environment—not excessive.
Noble Gold is Another Great Choice for Bullion!

Bulk buying note
Just like in prior years, volume still matters—but the savings gap has narrowed:
- Monster boxes and large bar purchases still reduce premiums
- However, in tight markets, bulk discounts may only save $1–$3 per ounce vs retail, compared to larger spreads in past years
- Wholesale inventory itself is under pressure, limiting deep discounts
Bottom line for 2026
The biggest mistake investors make right now is comparing today’s premiums to 2020–2024 norms.
This is a new pricing environment:
- Higher spot prices
- Tighter supply
- Stronger global demand
- And a growing disconnect between paper pricing and physical availability
Understanding that shift is critical—because in 2026, premiums are no longer just a cost…
they’re a signal.
How to spot transparent pricing from reputable silver dealers
Trust starts with visibility. Reputable dealers publish live market linkage, break out the markup, and show any shipping or payment fees up front. That makes it easy to compare net offers and make informed decisions.
What clear sellers display
Live spot-linked pricing: the listing updates as the spot price moves so you see real-time totals.
“Spot + premium” layout: each item shows the benchmark and the added premium or minting cost separately.
Upfront fees and shipping: exact shipping, insurance, and payment costs are listed before checkout.
Red flags to avoid
- Padded benchmark numbers that don’t match public feeds.
- Vague “as low as” prices that assume large quantities.
- Pressure to “call for quote” instead of showing firm, published prices online.
- Hidden add-ons that appear only at checkout.
Why published buybacks matter
Buyback prices give buyers a realistic view of resale value and the bid-ask spread. If a dealer posts both sell and buy numbers tied to the same spot price, you can gauge true costs before you shop.
| Feature | What to see | Why it matters | Action |
|---|---|---|---|
| Live pricing | Updates with market feeds | Prevents surprise swings | Compare timestamps |
| Premium breakdown | Spot + markup shown | Shows fabrication and dealer margin | Verify math |
| Published buyback | Buy and sell quotes | Reveals spread and resale value | Use to estimate break-even |
Practical tip: compare two to three reputable dealers, note timestamps or take screenshots, and focus on the total delivered price rather than marketing claims. Transparency lets you compute true cost per ounce and compare apples to apples when you shop.
How to calculate your true total cost per ounce before you buy
Work backward from the final invoice to reveal the full delivered cost per ounce so you can make informed decisions before you place an order.
Spot price + premium + fees: a simple total-cost formula that works
Formula: Spot Price + Premium + Fees = Total Cost.
Spot price is the live market number you link to. Premium is the dealer add-on for the product. Fees include processing, shipping, and insurance.
Convert a quote into delivered cost per ounce
If you buy different products, add each line total and divide by total ounces to get the true delivered cost per ounce.
Example approach: sum (spot + premium + item fees) for all items, add shipping/insurance, then divide by total ounces.
Payment methods, shipping, and quantity effects
Card payments in the U.S. often tack on ~3–4% processing, raising the overall cost; check/wire can lower the final price.
Free shipping thresholds matter: small orders look cheap until delivery and insurance are added. Bundling orders often cuts the per-ounce premium.
- Use dealer live pricing tools and confirm checkout fees.
- Compare total delivered cost, not just advertised add-ons.
“Calculate the delivered per-ounce number before you commit — then compare buybacks and spreads when you sell.”
How bid-ask spreads affect your break-even price and resale decisions
The gap between what you pay and what you can sell for is a real, measurable drag on returns.
Bid-ask spread means the ask (what you pay) versus the bid (what dealers will buy back). That gap is a cost you must recover before you make money.
Understanding dealer buyback pricing
Dealers typically list sell prices tied to the market but buybacks sit below the published spot price. Published buyback tables show the typical bid for common items and help you estimate resale value.
Why low upfront add-ons can still be costly
A low purchase markup looks good until you check buyback levels. Wide buyback spreads or low posted bids raise your break-even spot price because you must recover the premium, fees, and the spread.
| Factor | What it means | Impact on break-even |
|---|---|---|
| Upfront premium | Adds to entry cost | Raises needed gain to break even |
| Buyback (bid) | Dealer resale offer below market | Widened spread increases loss on exit |
| Product liquidity | Recognized coins vs obscure items | Higher liquidity often gives stronger buybacks |
Practical steps: check published buybacks, compute the round-trip cost (purchase total + expected buyback gap), and plan your exit timeline. Recognizable coins may cost more at purchase but often hold better buyback value, which can lower round-trip cost for many investors.
Conclusion
In markets where benchmarks move by the minute, your checkout total often tells the real story. The core idea from this guide — physical silver premiums vs spot price explained — is simple: the market reference is one thing; delivered cost and resale offers are another.
Understand how the spot is formed, compare coins, rounds, and bars, and insist on transparent dealer listings. Calculate the total cost per ounce and check published buybacks so spreads and liquidity don’t surprise you.
With tight supply and steady demand into 2025, marks can stay elevated. Use disciplined comparison shopping and match product choice to your goals. A quick nod to broader precious metals — think gold and platinum dynamics — helps, but keep silver-focused rules for better decisions about investments.
This is informational. Consider your risk tolerance before you act.