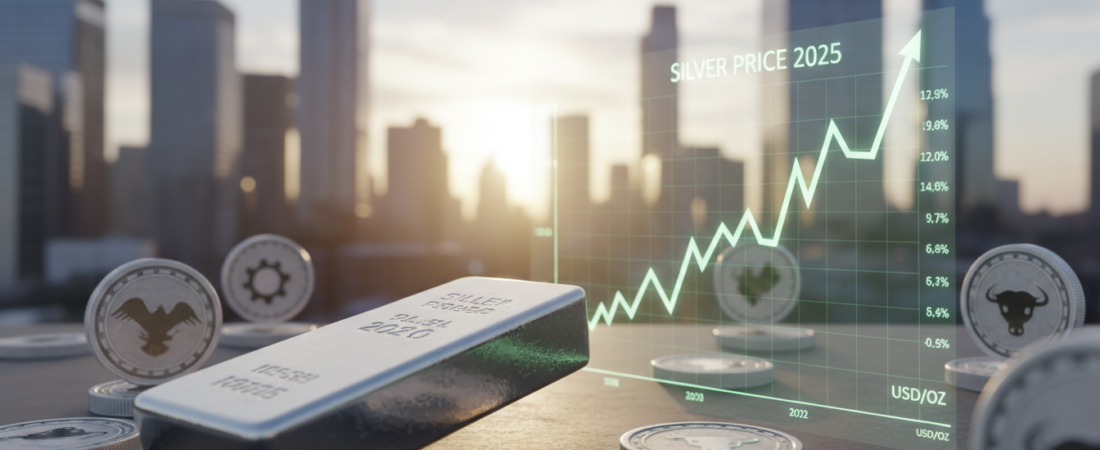
Silver surged to $57.16 per troy ounce late November — up about 90% year‑on‑year — while gold rallied past $4,000. This dramatic move startled the U.S. market and became a leading investing question: why silver hit record highs in 2025.
The rally pushed the entire precious metals complex higher. At times, silver climbed even faster than gold, lifting sentiment as stocks, bonds, and currencies wobbled.
What made this rally unusual was a two‑sided story: the metal acted as both a safe haven and an industrial input. That mix deepened demand and widened interest from traders and long‑term holders.
Key catalysts included tariff disruptions, a weaker U.S. dollar, strong seasonal buying from India, and tight supplies that strained inventories. Volatility stayed high — silver’s reputation as the market’s “Devil’s metal” meant sharp swings could follow big gains.
The article that follows will map the timeline, explain the drivers, examine vault and lease dynamics, and outline what the trend could mean for investors.
Key Takeaways
- Prices surged about 90% year‑over‑year, with gold also reaching new milestones.
- The rally mixed safe‑haven demand and industrial use, unlike past speculative spikes.
- Tariffs, dollar weakness, India buying, and supply tightness were major catalysts.
- Expect volatility: big rallies can include sharp pullbacks.
- The article will provide a timeline, driver analysis, and implications for investors.
Silver prices in 2025: the rally, the pullbacks, and the record highs
Prices moved sharply through the year, with quick rallies and sudden pullbacks that kept traders on edge.
From month-to-month surge to late-November peak near $57.16 per ounce
The market staged a series of upward moves across several months. A late‑November peak approached $57.16 per troy ounce, up roughly 90% year‑over‑year. After that high, the price pared back, then found fresh buying and climbed again.
That level mattered because it tested traders’ memory of prior peaks from 1980 and 2011. Breaking it had both psychological and technical weight.
How silver outpaced gold at points—even as gold pushed above $4,000 per ounce
At several points the metal outpaced gold, producing outsized gains versus the gold price. Reports noted big percentage moves—partly because the metal begins from a lower base, so momentum and retail flows amplify moves.
The gold‑silver ratio helped explain shifts. When that ratio narrowed abruptly, silver often caught up fast, producing sharp bursts of increase over short spans.
- Fast rallies drove headline moves month to month.
- Pullbacks shook out late buyers but did not end the broader rise.
- Volatility showed at points when trade policy, geopolitics, or dollar swings hit markets.
| Phase | Price Action | Why it mattered |
|---|---|---|
| Early rallies | Steady gains over several months | Built momentum and ETF inflows |
| Mid‑year pullbacks | Sharp drops that trimmed gains | Removed weak long positions |
| Late‑Nov peak | Near $57.16 per ounce | Psychological/technical breakout vs. prior peaks |
| Post‑peak | Partial retracement then resumed strength | Confirmed broader uptrend |
why silver hit record highs in 2025: the biggest drivers behind the surge
Global risk shifts and practical industrial needs together reshaped demand dynamics. The move was multi-causal, mixing safe-haven flows with real-world uses and logistical frictions.

Safe-haven demand amid geopolitical and economic uncertainty
Geopolitical tension and bond market volatility sent investors toward precious assets that feel less tied to stocks. That flight raised short-term buying and ETF inflows.
A weaker U.S. dollar and rotation to defensive assets
A falling dollar made dollar-priced metals cheaper overseas and boosted cross-border demand. This reinforced the narrative of metals as a defensive investment and helped lift value.
Tariffs, trade disruption, and the scramble to move metal to the U.S.
Tariff threats changed logistics. Banks and traders rushed to reposition stock to avoid higher import costs, tightening physical supply and shifting flows quickly.
Industrial demand tailwinds and India’s seasonal buying wave
Electrification, EV components, and solar cells drove steady industrial demand for conductive metal. India’s post-monsoon and festival purchases added a cultural surge in physical demand.
| Driver | Type | Expected persistence |
|---|---|---|
| Safe-haven flows | Financial | Medium (reverses with calm) |
| Dollar weakness | Macro | Medium to long |
| Tariff-driven stockpiling | Logistics | Short (event-linked) |
| Industrial & India demand | Structural | Long (technology + cultural) |
The supply crunch that fueled the boom: tight inventories, deficits, and stressed traders
When warehouses emptied and borrowing costs spiked, the market moved from steady gains to acute delivery stress. LBMA London holdings fell from 31,023 to about 22,126 metric tons between June 2022 and March 2025, cutting the available float and raising questions about clearing confidence.

London vault drawdowns and delivery strain
The fall in LBMA holdings mattered because fewer tons sit ready for prompt delivery. That short cushion raised market volatility and made physical settlement tricky for some participants.
Import dependence and shifting trade flows
India imports roughly 80% of its metal, and when UK supplies tightened the UAE and China stepped up to help meet demand. Those shifting flows kept trade lanes active but left little extra supply to absorb shocks.
Lease rates, short squeezes, and market size
Traders faced extreme borrowing costs; overnight lease rates implied near 200% annualized at times. In a market about one-tenth the size of gold, such stress can squeeze shorts faster and deepen a price boom.
| Issue | Data point | Impact |
|---|---|---|
| LBMA holdings | 31,023 → 22,126 tons | Tighter delivery confidence |
| India imports | ~80% dependence | Shift to UAE/China |
| Mine trends | Decline over 10 years | Deficit outlook |
“With fewer tons available and steep lease rates, market mechanics turned routine demand into an acute squeeze.”
Taken together, these factors show how supply limits and a shrinking production base can push a normal rally into a sustained boom. Use the gold-silver ratio as one cross-check, and seek deeper analysis before trading.
What the silver price move means for investors, traders, and the broader market
The surge forced U.S. investors to balance upside with real timing risk. Position sizing and clear stop rules proved more important than chasing headlines. Many investor accounts that added exposure near peaks saw fast gains and quick pullbacks.
Understanding volatility: “Devil’s metal” swings and timing risk
Devil’s metal captures how sharp rallies can reverse just as fast. Analysts warned that commodities can be boom‑bust, and buying near peaks carries real timing risk.
Gold vs. silver: reading the gold‑silver ratio
Use the ratio as a signal, not a guarantee. Gold tends to act as a steadier store of value while silver behaves like a higher‑beta precious and industrial hybrid for portfolios.
How investors got exposure and spillovers
ETF flows amplified the move: SLV took nearly $3.5B of inflows while GLD exceeded $20B. Those flows pushed related funds, mining equities, and some stocks higher.
What could happen next: scenario thinking
- Tariffs or trade shifts could tighten supply and lift prices further.
- A stronger dollar may cool demand for precious metals and ease pressure.
- Robust industrial demand would support a sustained boom; easing demand could trigger volatility.
“Even late in a boom cycle, near‑term forecasting stayed uncertain,” said several market analysts.
Practical takeaway: limit exposure, size positions as if each ounce might swing sharply, and treat this move as part of a wider asset allocation, not a guaranteed trend.
Conclusion
A year of mounting demand and shrinking inventories turned routine buying into urgent flows.
This summary answers the main point: a rare overlap of macro fear, dollar weakness, policy‑driven trade disruption, and tight supply met strong industrial and consumer demand to fuel the late‑year surge in price.
Across months, momentum and sharp turning points produced big gains while gold also set new milestones, reinforcing the broader metals story.
For readers tracking prices after a rally, focus on core drivers — dollar moves, tariffs, demand trends, and inventories — and respect timing risk. The next chapter will hinge on whether uncertainty, trade rules, and supply deficits persist. Revisit the timeline, drivers, supply crunch, and investor implications for practical guidance as news unfolds.